


According to a recent X post by noted crypto analyst Titan of Crypto, Bitcoin (BTC) is fast approaching a golden cross formation – a bullish technical indicator that often precedes significant price appreciation. However, other analysts caution that a price correction could be on the horizon for the world’s largest digital asset.
Bitcoin Inches Closer To Golden Cross Formation
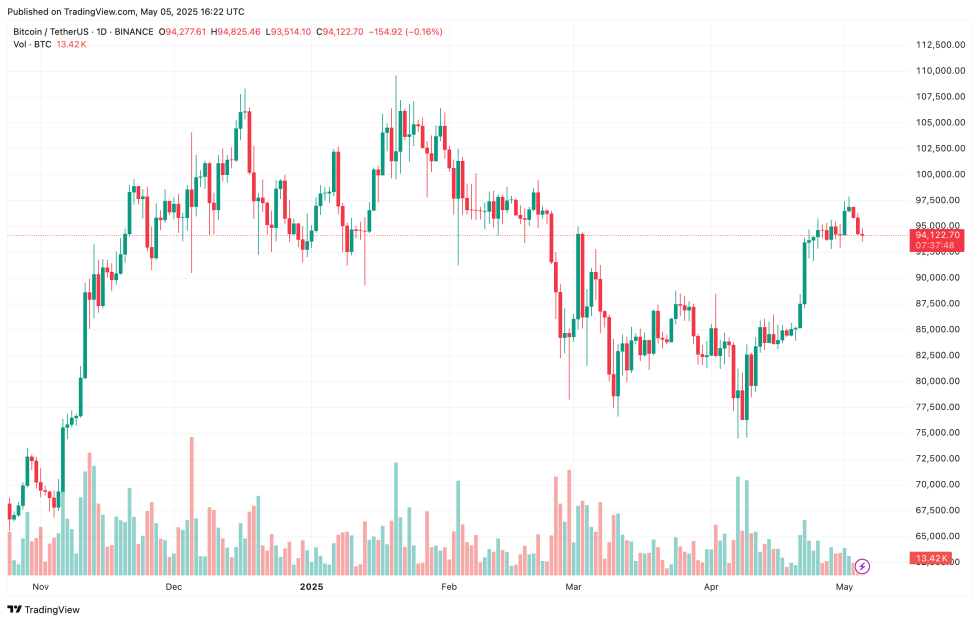
Bitcoin continues to trade within a narrow range between $92,000 and $98,000, offering limited directional cues for analysts. Still, some believe the flagship cryptocurrency may be gearing up for its next major move.
In a recent post, Titan of Crypto shared a chart showing that BTC is not only on track to form a golden cross but may also see its Moving Average Convergence Divergence (MACD) indicator flip bullish – a dual signal last seen in October 2024. At that time, Bitcoin surged significantly, bolstered by the victory of pro-crypto US presidential candidate Donald Trump.
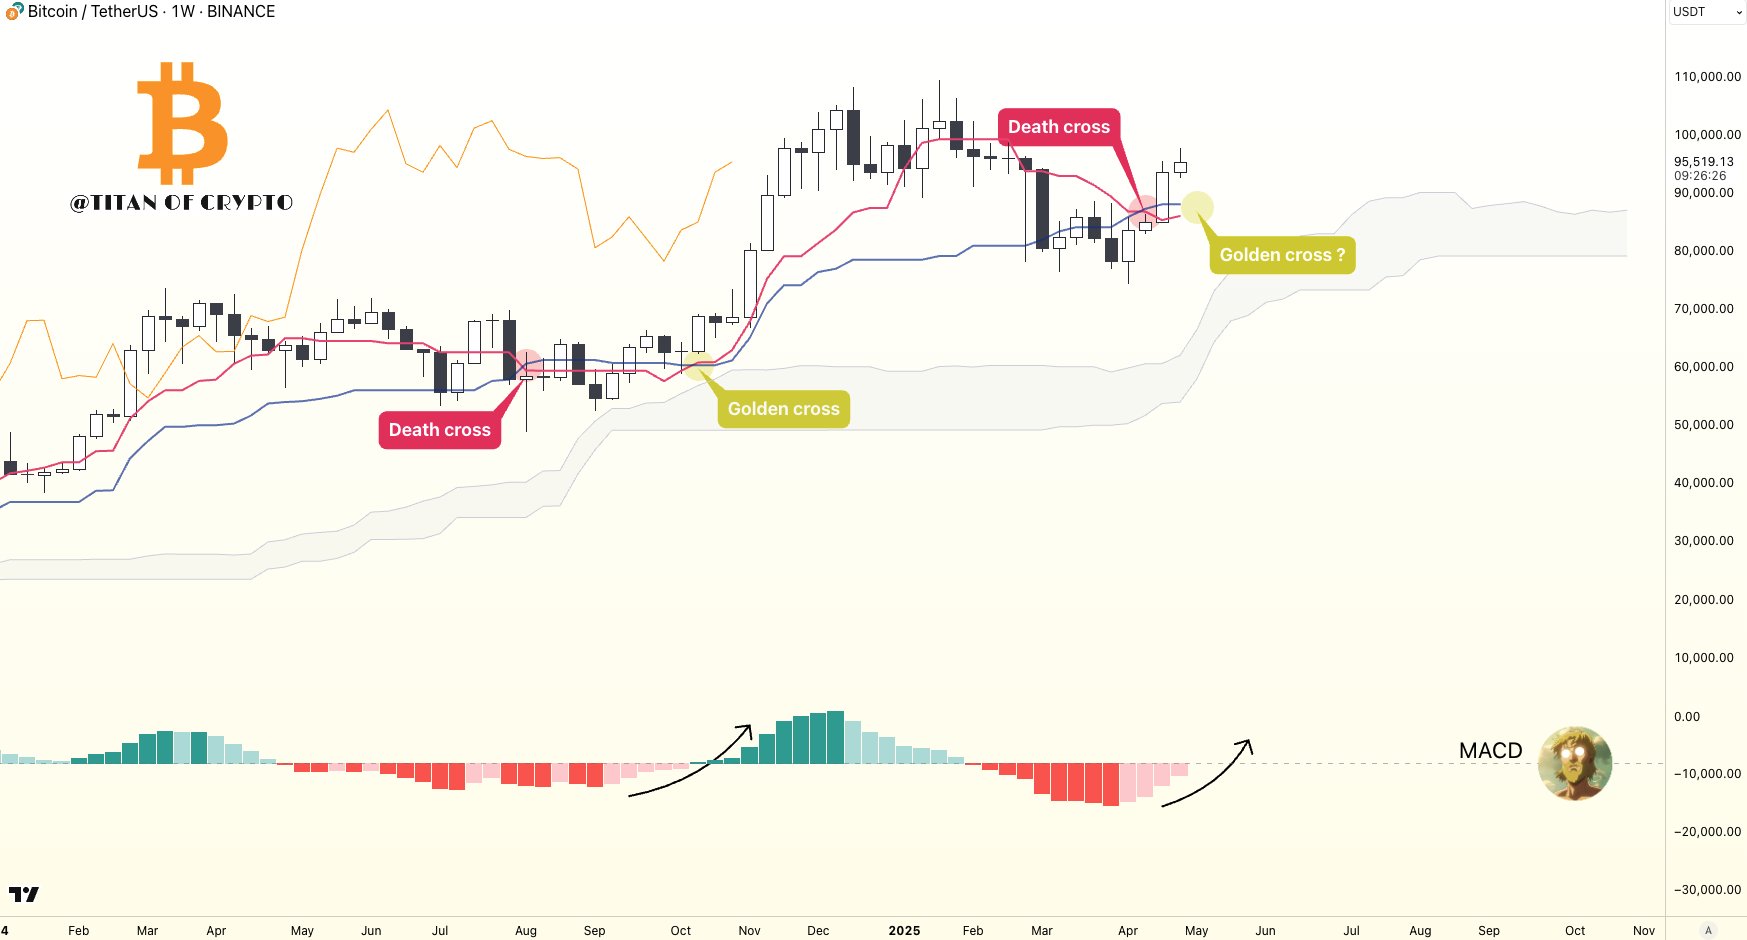
To explain, a golden cross is a bullish technical indicator that occurs when a short-term moving average – typically the 50-day MA – crosses above a long-term moving average – usually the 200-day MA. It signals potential upward momentum and is often seen as a sign of a trend reversal or continued rally.
Meanwhile, when the MACD turns bullish, it means the MACD line has crossed above the signal line, indicating a potential shift in momentum from bearish to bullish. This suggests that buying pressure may be increasing and a price uptrend could be starting.
Although BTC was recently rejected near the $98,000 level, crypto analysts, such as Rekt Capital, suggest this is expected behavior. For Bitcoin to break out to new all-time highs (ATH), it must first hold support at $93,500 and decisively break above $99,000.
Should it clear this resistance, BTC could face another rejection at $104,500. However, successfully flipping the $99,000 level into support would likely pave the way for a new ATH.
Not All Analysts Are Bullish
Despite the growing optimism, not all market observers are convinced a breakout is imminent. Prominent crypto analyst Ali Martinez pointed out that the TD Sequential indicator is currently flashing a sell signal on the 3-day BTC chart – a potential sign of short-term weakness.
Adding to the mixed outlook, BTC’s open interest in the futures market is now approaching historically high levels – a trend seen in previous bull markets that has typically led to price surge. At press time, BTC trades at $94,122, down 1.5% in the past 24 hours.
Featured Image from Unsplash.com, charts from X and TradingView.com
Editorial Process for bitcoinist is centered on delivering thoroughly researched, accurate, and unbiased content. We uphold strict sourcing standards, and each page undergoes diligent review by our team of top technology experts and seasoned editors. This process ensures the integrity, relevance, and value of our content for our readers.
